Load testing with Gatling and Selenium
Due to the rapid development of the IT industry and the constant growth in the number of network users, the issue of ensuring uninterrupted software operation is becoming increasingly important. Business dictates tough rules of the game on the market, and situations where the client is denied service become extremely dangerous, because the outflow of customers directly affects the company's income. With the advent of cloud technologies, the decision to expand the resource capacity for stable software operation is not something out of the ordinary. It's enough for the business owners to agree upon and apply for an increase in the platform's capacities, and the required capacity will be provided in a split second. But increasing the amount of resources without analyzing the performance of the software is a waste of funds. A poorly designed or coded product will consume more and more resources, quickly draining the budget.
The purpose of performance testing is to analyze the speed of work of the software under a certain load. This type of testing assesses the efficiency and performance before the software or its latest version is put into operation. It is also important to fine-tune and configure the server infrastructure before entering the market. From a business point of view, doing so shows whether the software is ready to enter the market and whether it will be able to guarantee operability to a certain number of users, or the required processing time.
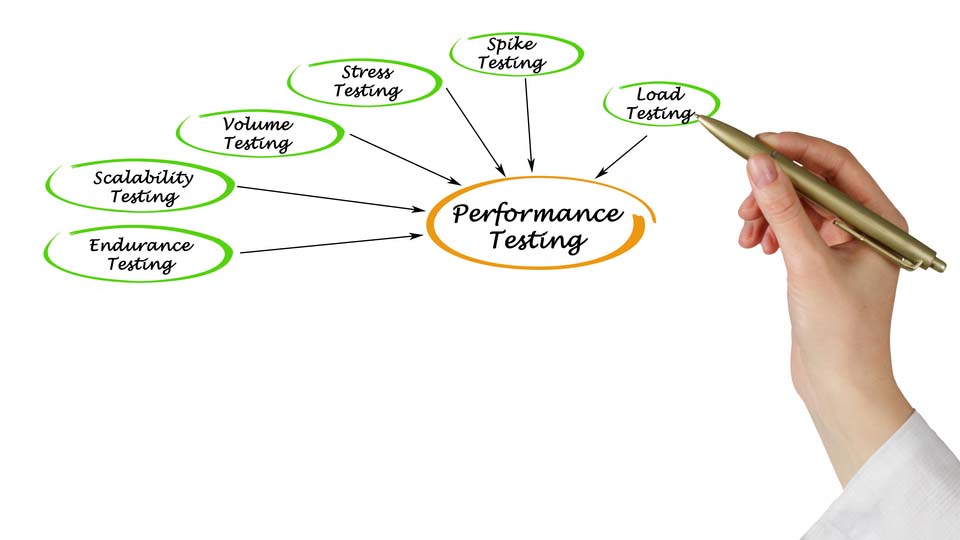
There are several types of performance testing:
- Load testing – this type of testing is conducted to determine how the system reacts to the expected load. This can involve testing the expected number of users or the execution of the required number of transactions per unit of time;
- Stress testing – is carried out in order to understand how the system works when the load is significantly increased or some components have failed. You have probably faced the consequences of neglecting of this type of testing more than once, when, for example, you were unable to order or pay for the goods you wanted on black Friday;
- Stability/reliability testing – is one of the most important types of testing, the goal of which is to identify problems in the software’s operation under a long-term load. This testing will help to identify both the problems of memory leaks of the software itself and any problems connected to the server infrastructure.
This article draws upon an example of performance testing for an ERP system. Before entering the market, we need to know how many users can effectively work with the application for a given configuration of the server infrastructure. This data will help us to introduce the software to the client in the optimal condition. So the first step is to test the system by gradually increasing the number of users to determine its capabilities.
Note: the article and programming code describe a testing concept, and hence contain a number of simplifications.
We have used the following scenario:
- A user logs into the system
- A user creates a sales order to sell two commodities
- A user forms a delivery note and invoice based on this sales order
- A user cancels and removes all created orders
- A user signs out of the system.
This simple script covers only one testing flow, but it provides the basic functions of creating, updating, reading, and deleting while working with data.
To generate the load, we have chosen open-source Gatling - a framework for load testing based on Scala, Akka and Netty. We used it because Gatling could describe a scenario using DSL, and because of its simple setup and integration with CI Jenkins.
After we have determined the capabilities of our system, we need to perform load testing with an average number of users and evaluate the overall experience of an end user. We use the Selenium framework to emulate the user experience and the Navigation Timing API standard to determine the execution time of the scripts on the user side.
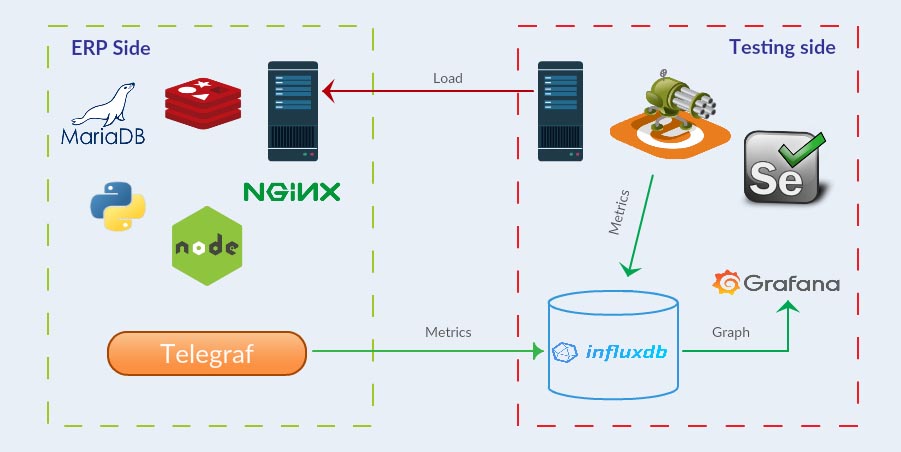
We also need to collect application metrics for easy analysis. Metrics will be stored in InfluxDB , while Grafana will take its visual display.
Our ERP system uses the following set of technologies: Nginx - web server, MariaDB - main database, Redis - in-memory DB, kernel is written in Python, frontend - Node.JS.
We use Telegraph to collect metrics from the production server. In order to configure the sending of data to Influxdb, we need to configure outputs.influxdb in the output plugins section:
Then, in the input plugins section you can configure the statistics aggregation for: CPU, HDD, Memory, Networks, and so on; plus (necessary for us) MySQL, Nginx and Redis. More details about the set of plug-ins and their configuration can be found in the official documentation. In order to collect Nginx statistics, we need to install the module with-http_stub_status_module and add the appropriate rule in the configuration file:
This image depicts a general scheme of the stand:
Gatling offers various options for applying the load onto the testing system. For the first task, we can use rampUsersPerSec (users) during (duration). This injects users from the start-up rate, specified in users per second, during a given duration. Users will be injected at regular intervals.
Using this method, we can increase the number of users by 10 times every minute until we find the maximum number.
For the second task, we use constantUsersPerSec(users) during(duration). This injects users at a constant rate, defined in users per second, during a given duration. Users will be injected at regular intervals. This allows us to keep a given number of users per second.
In order for Gatling to send metrics to our DB, we adjust the interaction with Graphite protocol in the configuration file gatling.conf
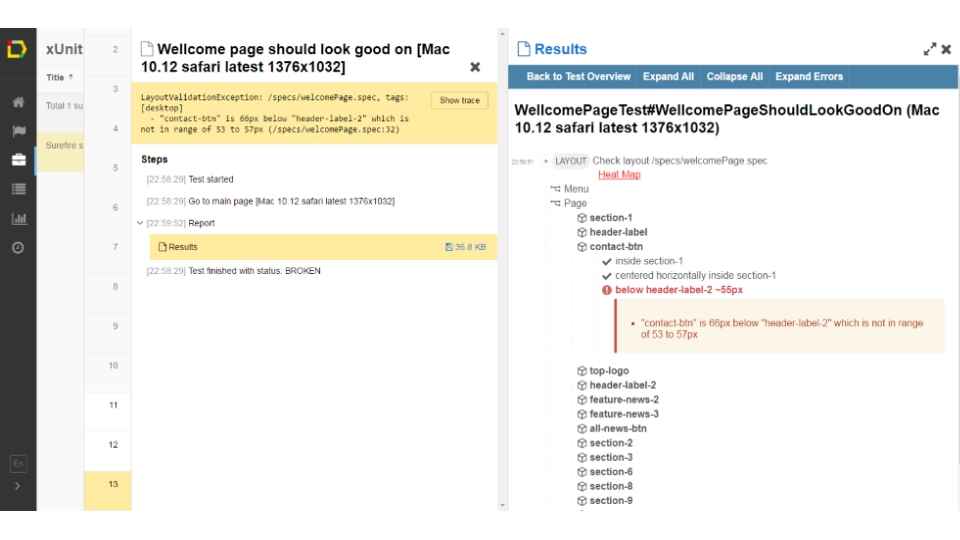
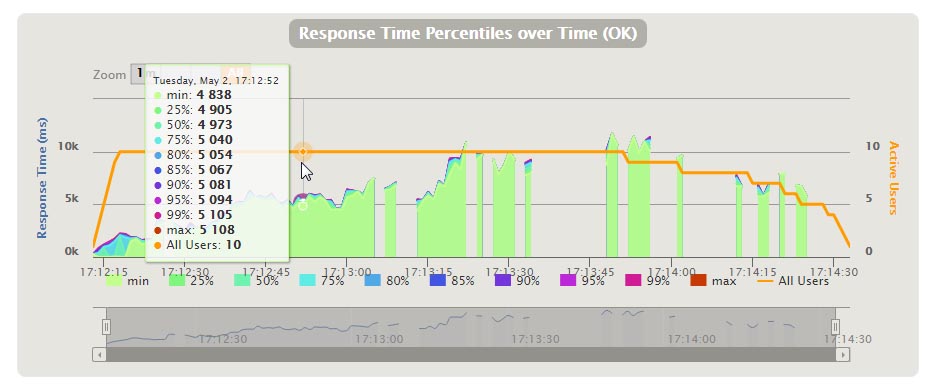
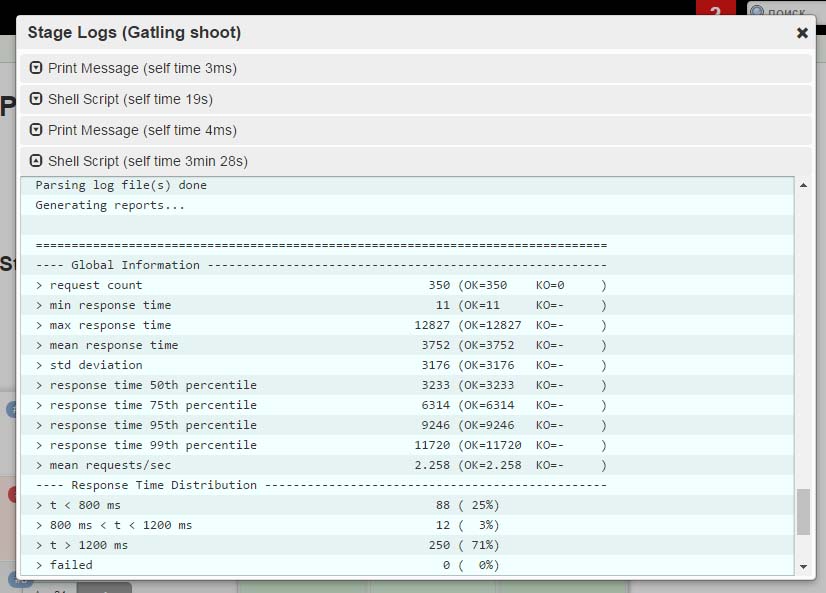
Gatling generates a response time report and produces percentiles of requests based on this data.
In order to get the values on the client side, we use the Navigation Timing API and its Performance API interface, which will help us determine the time of data exchange between the client and the server.
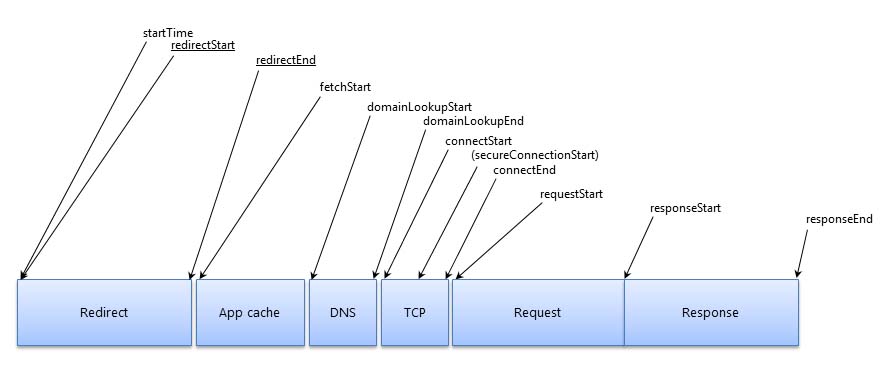
The PerformanceEntry object encapsulates a single performance metric that is part of the performance timeline.
Here, we are interested in the following parameters:
- startTime - the startTime attribute must return a DOMHighResTimeStamp [HR-TIME-2] with the time immediately before the user agent starts to queue the resource for fetching
- responseEnd - the time immediately after the user agent receives the last byte of the response, or immediately before the transport connection is closed (whichever comes first)
- duration - the difference between responseEnd and startTime
- name - this attribute returns the resolved URL of the requested resource
- transferSize - a number representing the size (in octets) of the fetched resource. The size includes the response header fields plus the response payload body (RFC7230)
We can collect statistics and build a timeline for each step of our scenario using this data.
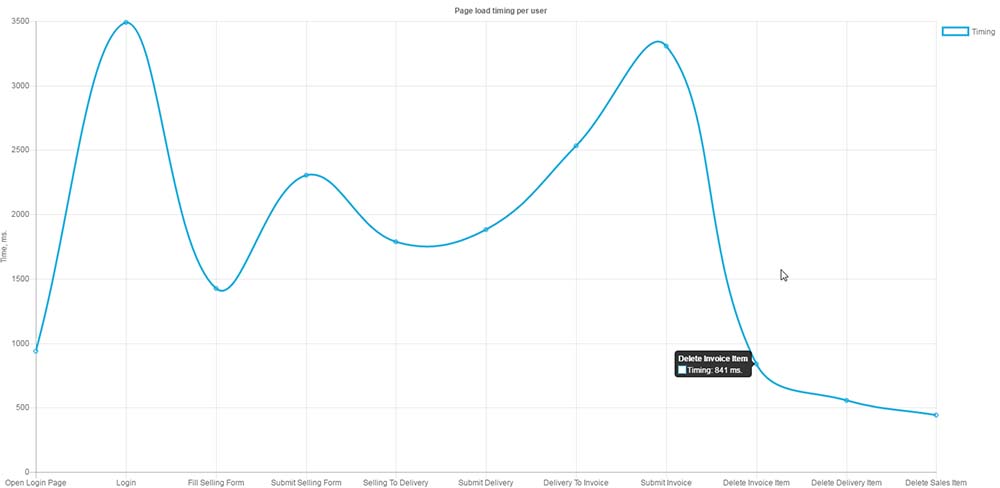
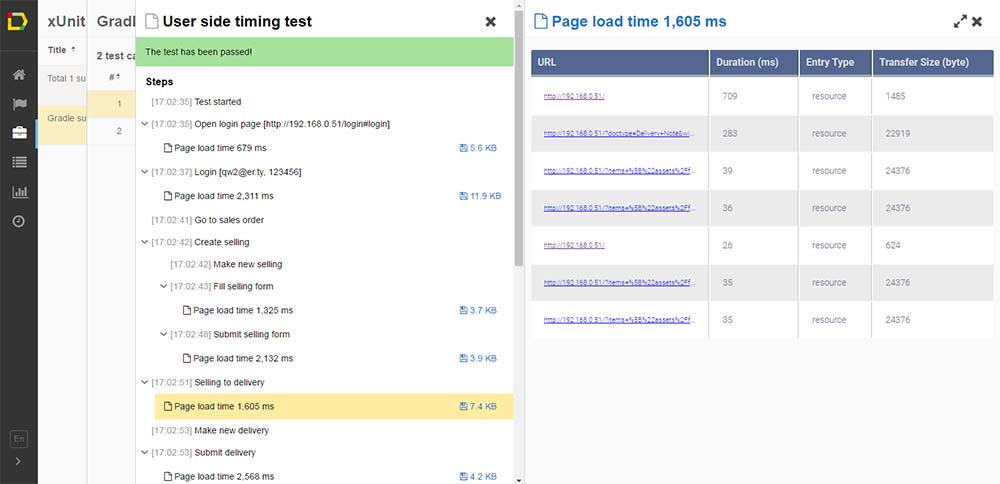
We also have data about each step:
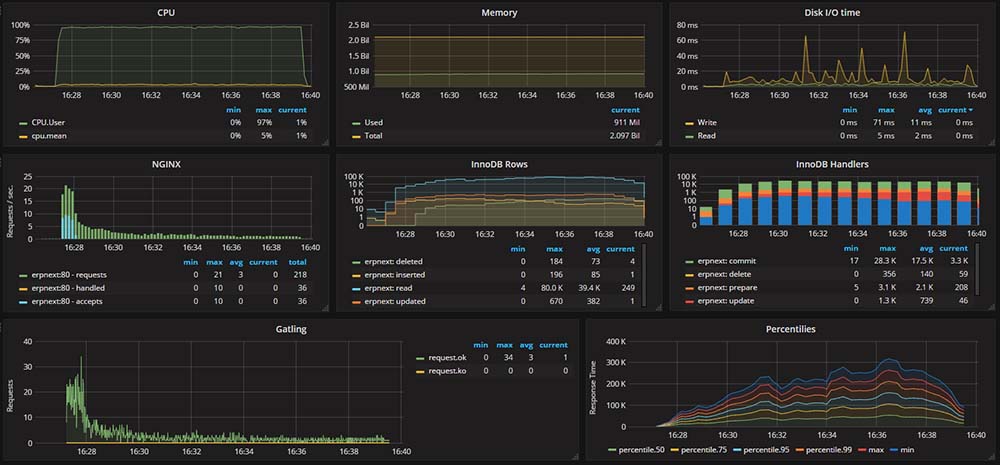
The metrics are collected and shown on the dashboard to monitor the process visually.
The last stage is the integration with CI in order to perform regular checks. We use the Jenkins Pipeline project, which has a built-in DSL for the description of the project. In the first project, we add a gradual build-up of users:
The second project combines testing of the client and server side. Its configuration is as follows:
There are two tasks here that will be executed simultaneously. There’s also input(message: 'Are you ready?', Ok: 'Yes!') that will wait for user input. It’s done this way so that the engineer can control when to run tests on the client side.
So we have built a stand for the load testing application that allows you to get data to analyze the processing power of the application. The data can help you configure the server infrastructure accurately, find weaknesses in the performance of the software itself, or prepare for peak loads. Conducting such tests before each release, we always know for sure that attracting new users won’t be a problem for us, and our software will always meet the quality standards.
Repository on GitHub with examples of code
Written by Artyom Anohin